VSS 2020 project
Posted on Fri 19 June 2020 in posts
Introduction
In this post, I'm going to attempt to explain my poster at the Virtual
Vision Sciences Society (VSS) conference, 2020, which starts today. The
poster itself, along with a video walkthrough, an approximate transcript
of that video, and some supplementary images, can be found on an OSF
page (view the README.md file for an
explanation of the contents) and, if you're a member of VSS, on their
website.
Big picture, in this project we study how vision changes across the visual field by investigating what people cannot see. We use computational models of the brain and human behavioral experiments to do this. In this post, I'll first try to give a High-Level Overview of this project, explaining what we do and why it matters. Then, in the Unseen Vision section, I'll spend some more time talking about the approach of studying what cannot see, which has a long history in vision science. I'll then dive into the specific models we use in the Models and the Visual System section, before finishing up and describing the experiment. Unfortunately, because of COVID-19, we have not been able to gather any data yet, but I do have some stimuli that we'll use in the experiment.
High-Level Overview
I am interested in how vision changes across the visual field. You can notice this by observing that, when your eyes are centered on this text, you can read it clearly, but if you move your eyes even a little to the side, you can't make any sense of it. What's going on there? Specifically, we investigate what information people are not sensitive to as you move away from the center of gaze. There are many ways one could approach this, but we're doing so by building models of two of the first stages of the brain that receive visual information: the retina (even though it's in the eye, it's made up of brain tissue and thus technically part of the brain) and the imaginatively-named primary visual cortex (or V1), inspired by our understanding of the cells there1. Those models have a single parameter, a number we can vary to change their behavior. I'll explain the parameter in more detail in the Models section of this post, but we then generate sets of images that the models (with specific parameter values) think are identical. We then run an experiment where we show those images to humans and find which images they also think are identical, finding the best parameter value for each model.
Once we've done that, we will have two models (with specific parameter values) where we know, if the model thinks two images are identical, humans will not be able to tell them apart 2.
Why does that matter? There are several reasons I find this work interesting:
- We're modeling specific brain areas, so the parameter has a meaning and therefore tells us something about that brain area. I'll discuss what, exactly, it tells us in the Models section.
- Our models were built based on an understanding of cells that comes from showing images to animals (generally, cats or macaques) and recording the activity of those cells using electrodes. Often these images are unlike most of what these or other animals see in their life (black and white gratings or moving bars being the most common). Taking understanding that comes from what happens when animals see something and using it to generate predictions for when humans will not be able to see something is a strong test of this understanding.
- We are abstracting away lots of interesting biology about these two brain areas areas and ignoring everything that happens after them3. If we can still generate images that humans find identical, it tells us that these are reasonable assumptions in these conditions (though there are other conditions where that might not be true).
- The model can tell us a way to compress the image: the model uses far fewer numbers than there are pixels in the image, and yet those numbers are enough to create an image that humans find identical. This is similar to other image compression methods, like JPEG: when you create a JPEG, it throws away information that it thinks you won't notice, so instead of recording each pixel value for a patch of blue sky, it says "this patch of 100 pixels should all be the same color blue", which takes far less space on your computer. And similar to our models, if you try to throw out too much information, people will notice.
- This is a first step towards the creation of what we call a foveated image metric. That's a technical term, so I'll unpack it in parts. An "image metric" tells you how different two images are. The simplest way to do this is to use the mean-squared error, or MSE, where you go through and check how different each pixel value is. But ideally, our measure of how different two images are would map onto how different humans think two images are, and humans and MSE do not agree4. You can run experiments to find how different humans think to images are, but that takes a lot of time, so we want to come up with some computer code that can do it for us. With our models, we can say whether humans will think two images look the same, but if the images look different, our models won't tell us how different they look – that's one extension of this project. And "foveated" means that we care about where people are looking in the image; the alternative assumes that people are free to move their eyes everywhere. This point and the last one about compression are related: if you know how similar two images look, you can figure out clever ways to throw away information without changing the perception of the image too much.
Unseen Vision
In my video, I start by discussing the idea that we can study vision by studying what people cannot see, and it's worth talking about this in more detail, because it's a powerful idea, but not an intuitive one.
You're probably aware that color displays, from cathode ray tube screens to liquid crystal displays to projectors, all use three different color primaries (red, green, and blue) to render the colors they show. But how is it that you can use only three different colors to render all of the many different possible colors that humans can view? Because of cones – (most) humans have three types of cones, and so you can get away with only three primaries. But why? And the theory of human trichromatic vision (that humans have three classes of photoreceptors sensitive to color) was first postulated by Thomas Young in 1802, more than 150 years before the physiological evidence for their existence. How?
The existence of three cone classes was theorized as a way to explain the results of color matching experiments, done in the 18th and 19th centuries. In those experiments, participants were shown two lights on either side of a divider. One light, the test light, was a constant color, while the other, the comparison light, was made by combining three different primary lights (for example, red, green, and blue) with different intensities. The participant's task was to adjust the intensities of these three primaries until the two lights looked identical. And people could do this, for any color test light, as long as they had three primaries. And these results were remarkably consistent across people – just about everyone could match colors as long as they had three primaries, and they used the same relative intensities, but they couldn't do it with two5.

Brief digression to talk about the nature of color, with the caveat that I do not study color (it's a whole separate area of vision science) and so everything I say should be taken with a grain of salt (if you're interested in this, I recommend reading the chapter on color from Brian Wandell's excellent Foundations of Vision, available for free online). But, technically, color is not a property of an object, it's an interaction between the object (how much light it reflects at each wavelength), the lighting conditions (how much light is present at each wavelength), and the observer (how their visual system interprets the light that arrives at their eye). So, there are no blue dresses, there are just dresses that appear blue to me under specific lighting conditions. That may sound purposefully obtuse, but it's important to keep in mind. If you remember the Dress, a viral image from several years ago, it is a striking example of ambiguity in color perception: some people see it as black and blue, where others see it as white and gold, and people often have very strong opinions on which they see, with few people able to see both6. This demonstrates that "color" is not as straightforward a label as we think, so I want to be clear about the differences between perceptual color (what I mean when I say "that dress is blue", which depends on all of the object, lighting, and observer) and the light that arrives at the eye (the amount of energy at each wavelength, known as the power spectrum, which just depends on the object and the lighting).
In the color matching experiment, the two lights were perceived as identical by the participants, but the power spectrum were very different. But the participants didn't notice the difference because their visual system had discarded all information that could separate the two. The two lights are called metamers: they're physically different, but perceptually identical. Like I said earlier, this is because (most) humans have three cone classes. The two lights appear identical because the cone activity for the two of them are the same. They have different amounts of energy at each wavelength, but they excite the cones the same amount, and so you have no way of telling them apart and thus perceive them as identical.
This may seem weird at first – we have a tendency to think of our visual system as conveying accurate information about the world around us. But that's not what it does! It conveys useful information about the world around us, where useful is in evolutionary terms. Think about the electromagnetic spectrum. Our visual system is only sensitive to visible light, not infrared or ultraviolet. But light at those frequencies are still present in the world and arrive at our eyes – we just can't make use of it because our visual system throws it away. Our cones only respond to lights between 400 and 700 nanometers, and so we cannot tell the difference between a blue dress and a blue dress with a UV lamp behind it. Other animals' cones, however, like bees and some birds, are sensitive to ultraviolet light, and so their visual system can make use of it.
So alright, human visual systems aren't perfect and can be tricked in this fairly arbitrary way. What of it? Well, now I can describe a color using only three numbers, the intensities of each of those three primary lights, rather than requiring me to specify the full power spectrum, which would require a number for each possible wavelength in the visible spectrum. That's a lot less information! I've gone from 300 numbers to just 3. This is why I only need three color primaries in a display – I can't reproduce any possible power spectrum, but I can match the perceived color pretty well. It would be much harder to fit all the necessary lights into a screen if we needed 300 of them. I've made use of my understanding of the human visual system to compress the information about the color. This is one important application of this type of work: if we know what information the human visual system throws out, we can throw away that same information in any thing we build that interacts with the human visual system (you might want to hold onto it for other reasons, but for most situations where you just want an image to look good, it's fine).
And note that this whole thing is based around investigating what humans don't see. We've found changes we can make to the physical stimulus (in this case, the power spectra) without humans being able to tell that anything is different. This isn't about what colors look like: why do some colors complement each other? What makes a color stand out? How hard are these two colors to tell apart? There's a whole host of interesting questions there as well. In the color case, the experiments to find what people cannot see preceded the theory about the visual system that explains why. But these types of experiments can also serve as a strong test of our theories and understandings of the visual system: we should be able to use our understand of how the system works to generate images humans cannot distinguish. And we should be able to do this not only by throwing information out of an image and predicting you can't tell, but also by adding new information that you won't be able to see. That's the goal of this project, to build models of early stages of the visual system based on our understanding from other experiments, generate images that the models think are identical, and run an experiment to see which images humans also think are identical.
Models and the Visual System
With the previous section, I hope I've shown how studying what people don't see can be a useful way to increase our understanding of the visual system. In this project, we use that approach to study how vision changes across the visual field. This is a pretty drastic effect: when your eyes are fixated on this text, you can read it without a problem, but if you move your eyes to the edge of the computer screen, then the text becomes illegible. Why would this be the case?

First, let's talk a little about the layout of the visual system. I'm going to talk about the flow of information in the brain: information enters via our sensory systems and gets processed and transformed by a series of connected brain areas. These transformations, or computations, are what my research focuses on. How can we recognize faces so easily from an image, which is just a bunch of points of light? Because the human brain transforms those points into some more meaningful representation that allows us to easily determine how "face-like" something is. But the fact that it has taken years to get computers to be able to recognize faces with any accuracy (and they're still not that good, and have all sorts of biases) should emphasize how hard this is. To return to the anatomy: when light enters the eye, it travels through the lens to the back of the eye, called the retina. From there, the information gets sent to a section of the thalamus, deep in the brain, called the lateral geniculate nucleus, or LGN (generally speaking, in visual neuroscience we tend to consider the LGN a relay station that doesn't transform the information at all, and so ignore it). From there, it goes to the primary visual cortex or V1, before going through a succession of other similarly-named areas: V2, V3, V4, etc. In this project, we build models of V1 and the retina.
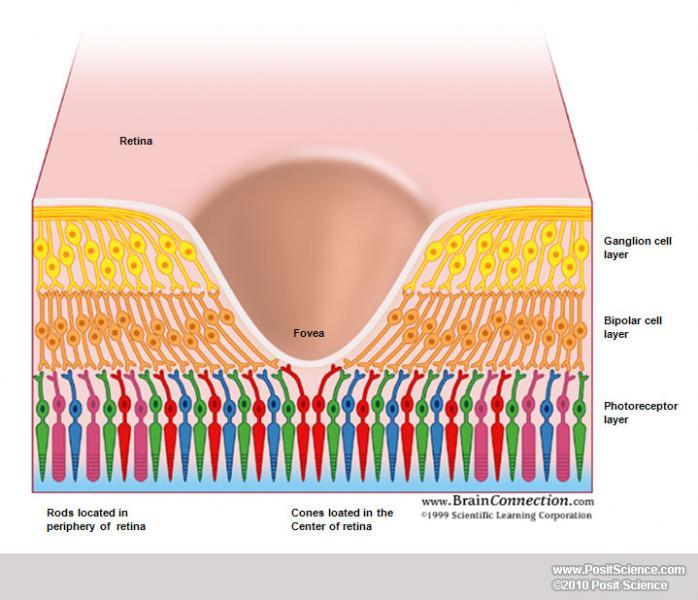
The visual field is what you're seeing at any given time. When we discuss the visual field, we're less interested in the physical objects out in the world than we are in the patterns of light that these objects reflect or emit that land on your eye. The center of your visual field, where your eyes are fixating at any one point in time, is the fovea. The term comes from the Latin word for "pit" and describes an interesting anatomical feature of the retina: the cells in front of the cones are shoved to the side so they don't get in the way of the light. This is the region of highest acuity. As you move away from the fovea, you eventually enter the para-fovea, and then end up in the periphery, your acuity decreasing gradually all the way78. These terms are used to refer to the anatomy of the retina and later brain areas as well as to the perception of that part of the visual field. So if we're discussing what you see where your eyes are centered, that's "foveal vision" or just the "fovea". Finally, when talking about locations in the visual field, the distance from the fovea is the eccentricity and it's measured in degrees of visual angle, such that you'd say "the image was presented at 10 degrees eccentricity" when describing the stimuli in an experiment.
The visual system is a portion of the brain (in primates, quite a large portion!) and so, like the rest of the brain, is made up of specialized cells called neurons. As a computational neuroscientist, I don't think so much about all the interesting biology of neurons, and really only think about them in terms of their activity. People spend their entire lives studying neuronal activity, but for my purposes all we need to know is that it's the way neurons communicate with each other, so if something isn't reflected in neuronal activity, the visual system doesn't know about it. To return to our color example, ultraviolet light has no effect on cone activity, and so the visual system knows nothing about it.
If we want to understand the visual system, we should understand what makes neurons active and how that activity changes. One of the foundational results in visual neuroscience was the discovery of receptive fields in the 1950s and 1960s by David Hubel and Torsten Wiesel. They found that neurons in cat V1 got active when they moved a bar into a certain portion of the visual field, and were not active when the bar was in any other portion of space9. This is the neuron's receptive field, the portion of the visual field that the neuron cares about10. These receptive fields grow larger as you move away from the fovea and also as you go deeper into the visual system, so that foveal retina receptive fields are tiny (the size of a cone), whereas peripheral V4 receptive fields are giant (a quarter of your visual field). In the beginning of this section, I pointed out that your vision gets worse as you move away from the fovea, and the way it does this seems a lot like it's "getting bigger": things in your periphery appear somewhat blurry and hard to distinguish from each other. That seems like it might be related to receptive fields growing larger as you move away from the fovea, so that's what we're going to focus on. There may be other important differences between the fovea and periphery, but for this project, the only difference is that receptive fields have grown larger.
Visual neurons are sensitive to more than just a region of space. Hubel and Wiesel found neurons that only responded if the bar was in a certain portion of space and had a certain orientation (such as vertical or horizontal). This led to the idea that neurons are sensitive to "features" as well as locations11. In V1, the main features are orientation and size12, and across all of V1, they, along with location, are all represented. This information about orientation and size is called spectral energy. We know each orientation is represented everywhere in the visual field, but size isn't (there aren't neurons that respond to small things in the periphery and neurons responding to big things might not be found in the fovea13). However, for our models, we're going to say all orientations and all sizes are represented everywhere in the visual field14. Different visual areas care about different things. Retina does not care about orientation or size: for our purposes, it only cares about brightness1516. These things that the brain areas care about are called summary statistics.
Those are the core ideas for our models: brain areas compute summary statistics and the main thing that changes with eccentricity is the size of these receptive fields. So let's put them together: what do we do with those summary statistics in those receptive fields? Let's take the simple approach and just average them. So, a neuron's activity is based on how much of its favorite stuff is in its favorite area of the visual field. A given neuron in V1, for example, might care about how much "vertical-ness" of a certain size there is in a given patch of the visual field, and measuring that in an image is a pretty good way to predict how active that neuron will be when the animal is shown the image. A given neuron in the retina, on the other hand, might care how bright a certain patch of the visual field is. Note that the neurons are ignoring the details that gave rise to those statistics (the retina neuron just cares about the average brightness in its favorite area, not whether that brightness came from a really bright object and a really dark object, or two medium-bright objects) – which means we're throwing away information! This is where we return to the concept I discussed in Unseen Vision: if we're throwing away information, that means we can find metamers. Also note that the amount of information the model throws away increases both as the receptive field grows and as the number of statistics shrink, and these happen independently17. I'll return to this idea when I describe the experiment in more detail in the next section.
When we build these models, we have two choices: the statistics they calculate and the size of the windows (I'm going to refer to them as "pooling windows" from now on, and use "receptive fields" only to refer to actual neurons) they average them in. We pick the statistics based on our understanding of the visual system. This is important – in no part of this study do we test different statistics to see which is best. We build in the assumption (based on decades of research) that we can summarize an important part of neuronal activity in the retina and V1 by using brightness and spectral energy. We're also going to say that window size grows with eccentricity18, and the only thing we need to find in our experiment is how quickly it grows. This scaling, as we call it, is the model's only free parameter, i.e., it's the only thing we fit to the data. Finding it is the goal of the experiment that we have not yet had a chance to run, because of COVID.
To summarize, in this project, we built models of the retina and V1, which average summary statistics in windows that grow larger with eccentricity. To see how well they model human perception, we generated model metamers, images that are physically different but that the model thinks are identical. In the next section, I'll discuss the experiment we're planning on running in order to test those models.
Experiment
Still working on this!
- There's a part of the brain betwen the retina and V1, a region of the thalamus, deep in the brain, called the lateral geniculate nucleus. However, in visual neuroscience we often consider it to be a relay station that just transmits signals between the retina and V1, so we ignore it in this project ↩
- At least, under the conditions of our experiment. ↩
- This is known as a feed-forward approach to the brain, assuming information flows through the brain in one direction and ignoring all the feedback that happens. ↩
- See this paper from Zhou Wang and Alan Bovik for more details. ↩
- There were some people, it turns out, who could do it with two primaries – people with dichromacy, a form of color blindness). ↩
- The current understanding is that it comes down to differences in what you (implicitly) assumed the lighting condition was when the photo was taken. If you thought the light was yellow-tinted, you'll see the dress as black and blue; if you thought it was blue-tinted, you'd see the dress as white and gold. Wikipedia has a decent explanation on this. ↩
- To my knowledge, there are no agreed upon boundaries for any of these terms, except for the fovea; there is an anatomical boundary where the actual pit of the fovea ends. ↩
- Interestingly, not all animals have foveas, and some birds have two! It seems to be present in animals that need precise information about the location of objects, like primates, birds, and cats. But prey animals, such as mice and rabbits, do not have foveas, and often have quite poor visual acuity. Again, this comes down to the fact that the visual system is about capturing useful information to the organism, and fine spatial information is not important to mice. ↩
- You can find footage of this experiment on YouTube (the clicking noise is the neurons firing action potentials, and the more often that happens, the more active they are). ↩
- The concept comes from Sherrington, who used it to describe the area of skin from which a scratch reflex could be elicited in a dog. ↩
- I put "features" in scare quotes because I have lots of feelings about the features neurons are responsive to – they're often not nearly as human-interpretable as we'd like, and I think the idea that V1 neurons are "edge-detectors", a common interpretation of Hubel and Wiesel's studies (including by the original authors), has led to a lot of confusion in visual neuroscience. But that's outside the scope of this post. Though I do recommend reading Adelson and Bergen's great paper on The Plenoptic Function if you're interested in this. ↩
- Technically, spatial frequency, but for the purposes of this post we can call it size. ↩
- This is actually the topic of the first major project I worked on in grad school, as presented at VSS 2018. I still haven't finished it yet, however, because science is slow. ↩
- Changing this is one of the extensions of this project that we're working towards: removing unnecessary information about size / spatial frequency based on location in the visual field. ↩
- Folks who actually study the retina will not like this characterization, which ignores lots of interesting stuff that happens in the retina, but it's enough for our purposes. ↩
- Later areas in the visual system get much more complicated quickly, and there's not nearly as much agreement on them as there is about V1. ↩
- By which I mean, for a given number of statistics, you'll throw away more information as the receptive fields grow, and, for a given size of receptive field, you'll throw away more information as the number of statistics shrinks. ↩
- Specifically, based on a literature review shown in Figure 1a in this paper, we're going to say that their width grows linearly with eccentricity ↩